Primary financial data
Financial information for the past five years is presented in graph form.
Restaurant information
Restaurant sales (including overseas)

Transition in number of restaurants (including overseas)

Number of restaurants by type, end of February 2026
| Domestic | Overseas | Sum total | |
|---|---|---|---|
| Number of directly managed restaurants | 167 | 85 | 252 |
| Number of FC restaurants | 1,118 | 133 | 1,251 |
| Total | 1,285 | 218 | 1,503 |
Business performance information
Sales

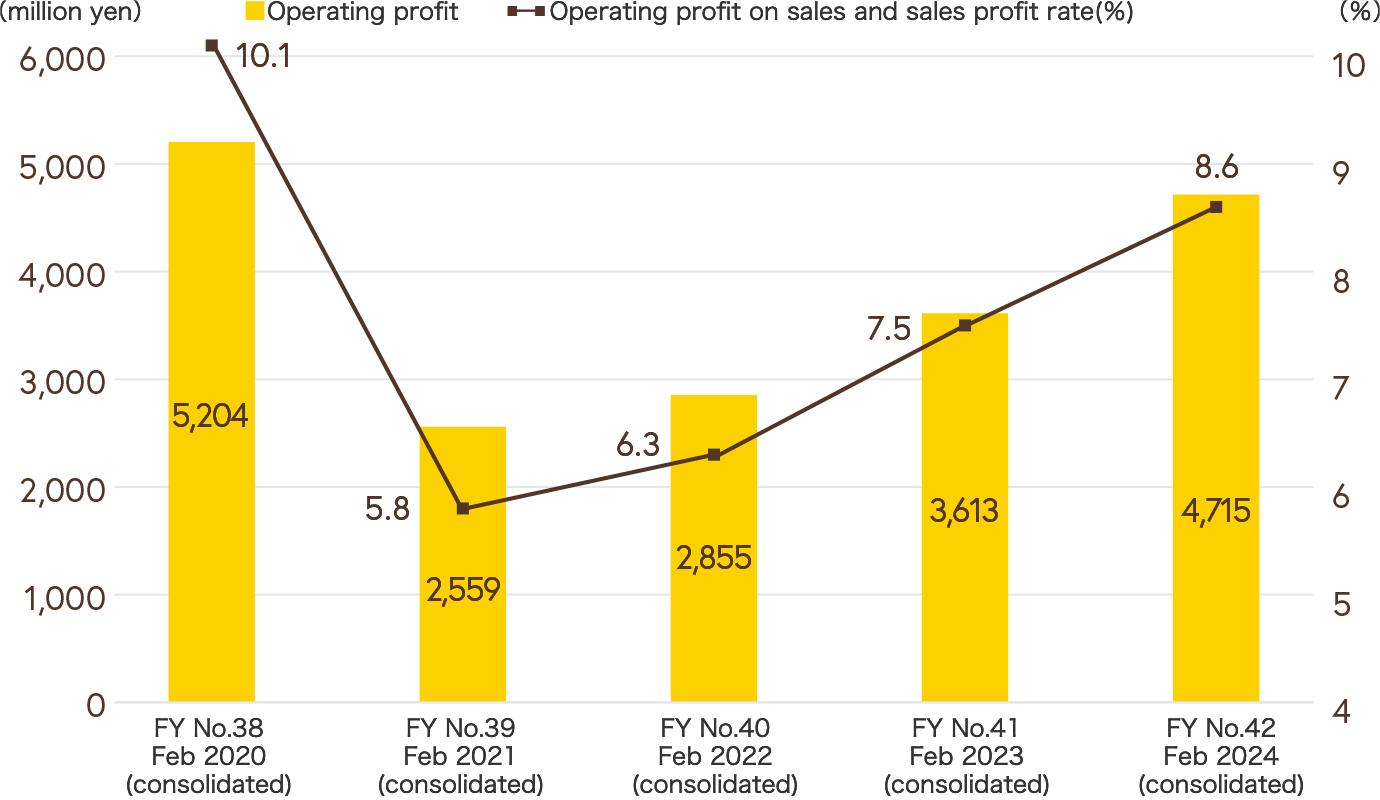
Operating profit and operating profit on sales
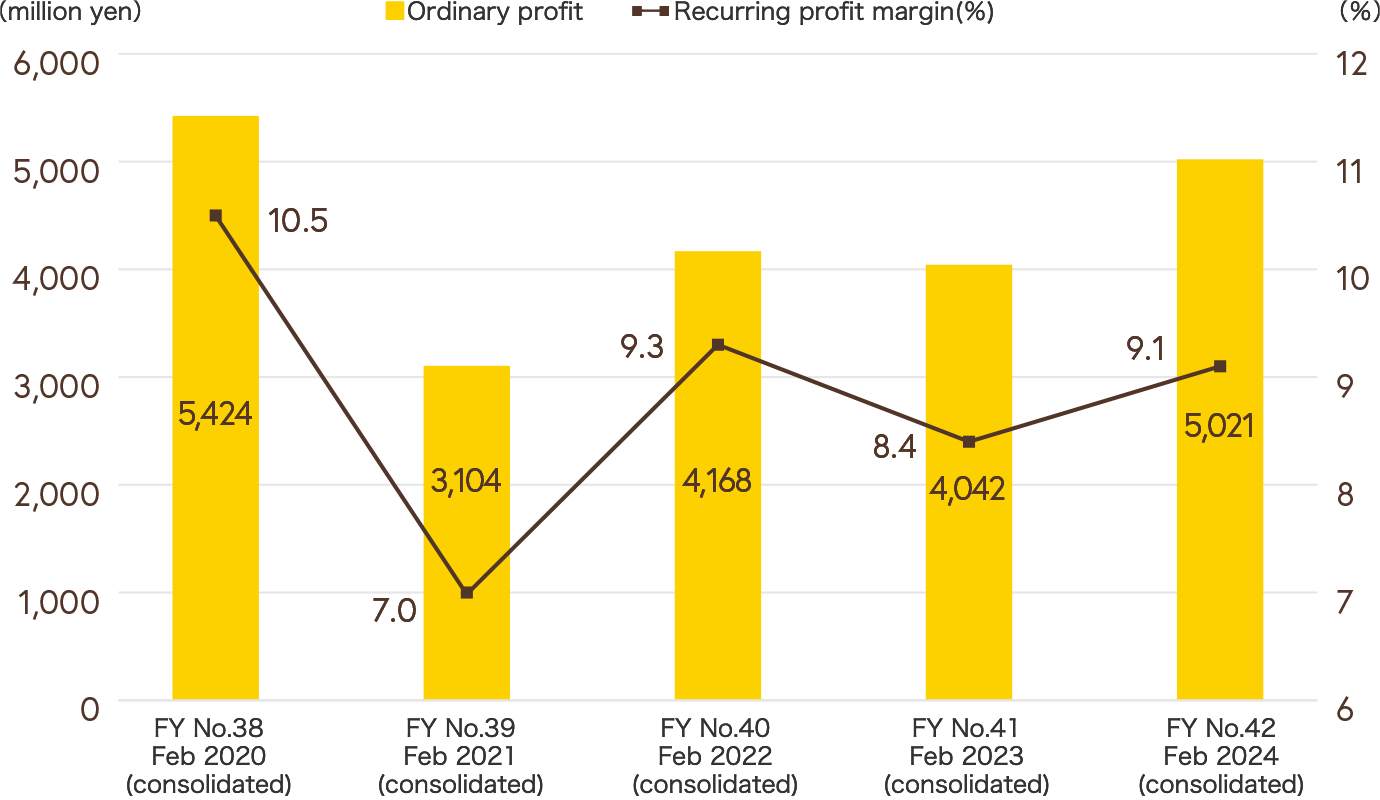
Ordinary profit and recurring profit margin
Current net profit and current net profit to sales

Total assets and net assets

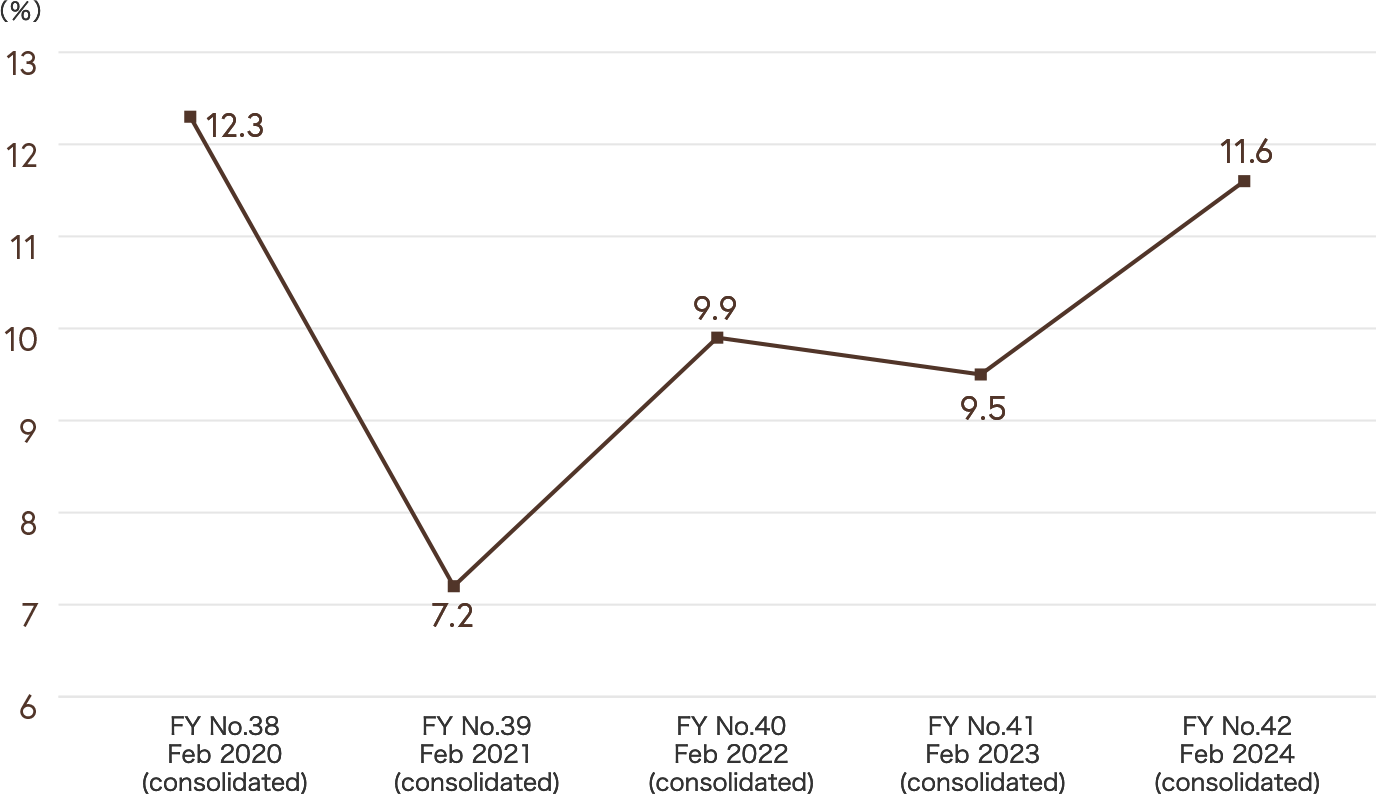
ROE (return on equity)

ROA (return on assets)
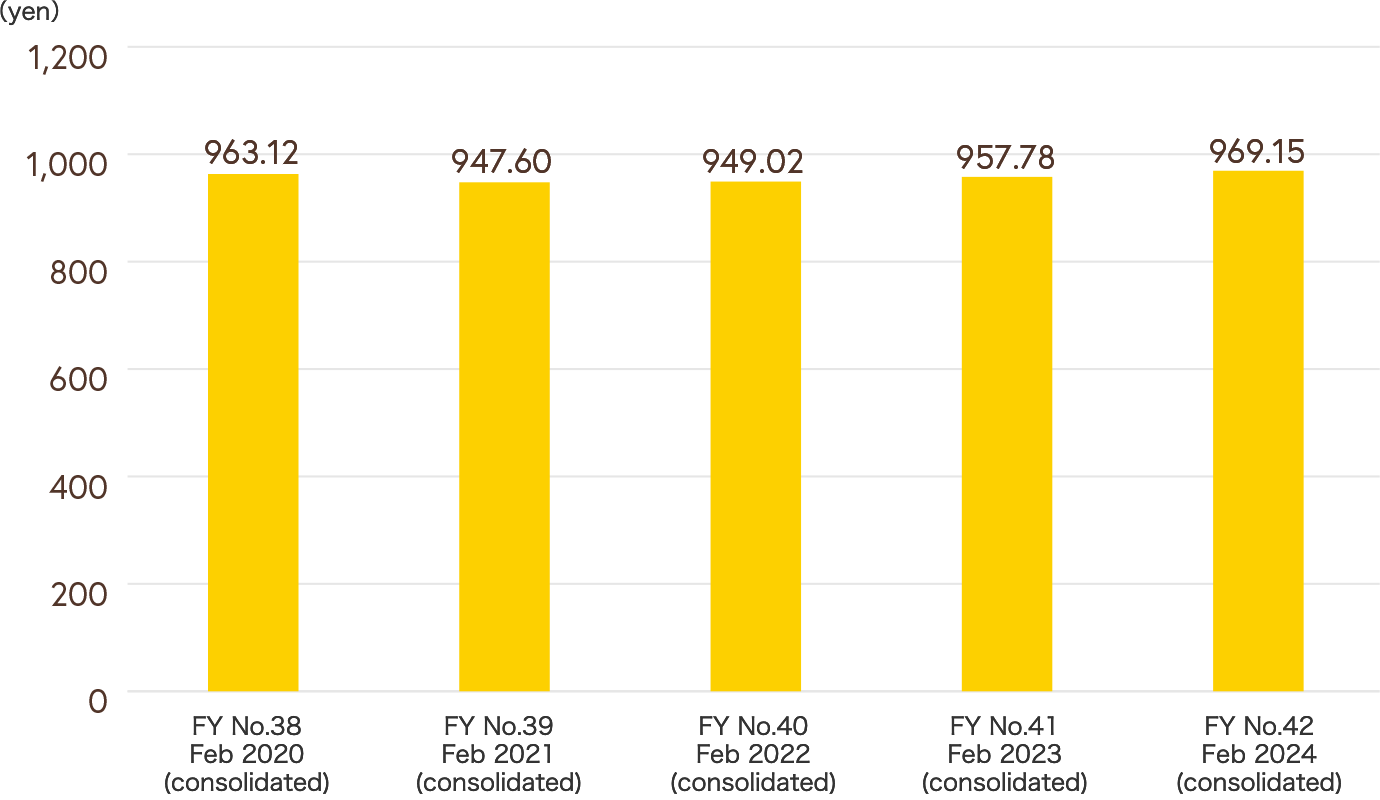
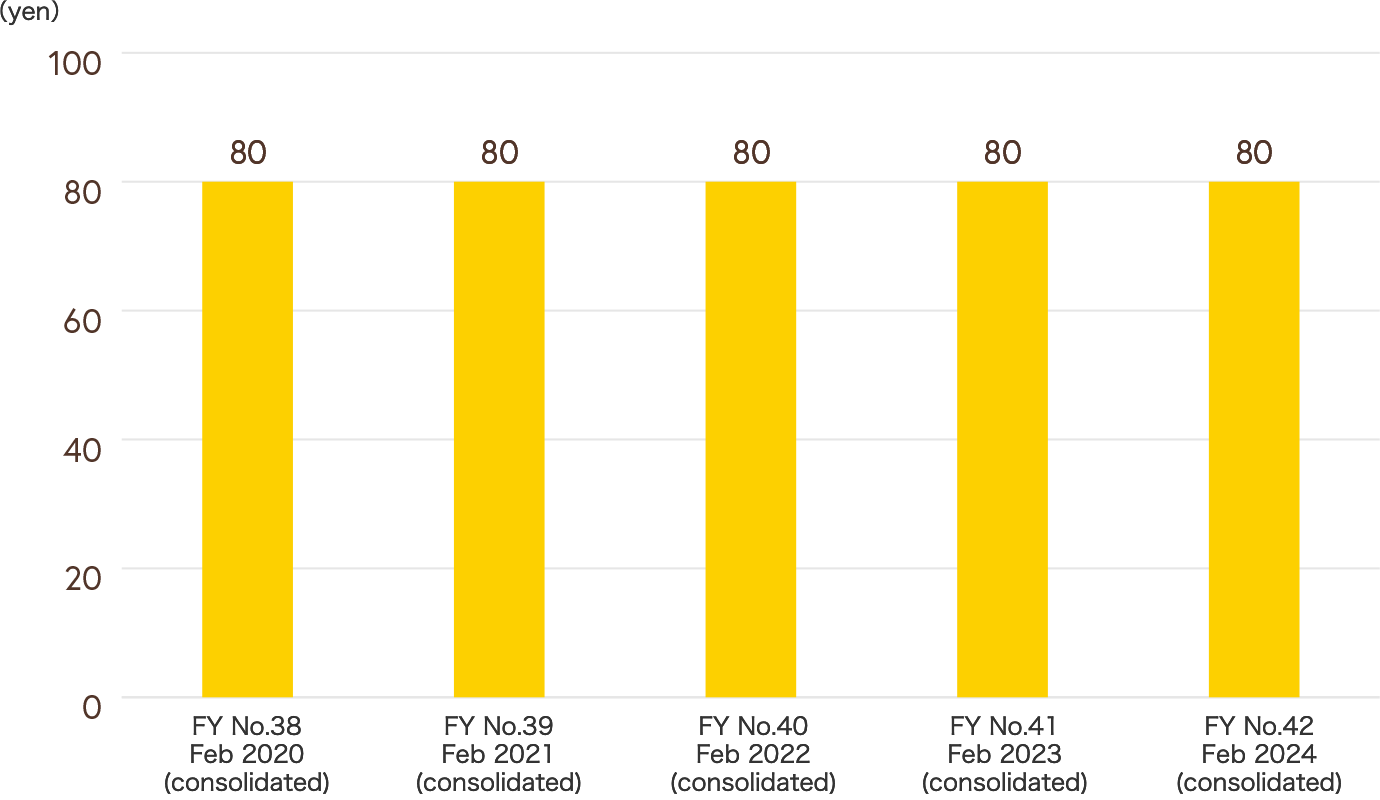
Per share information
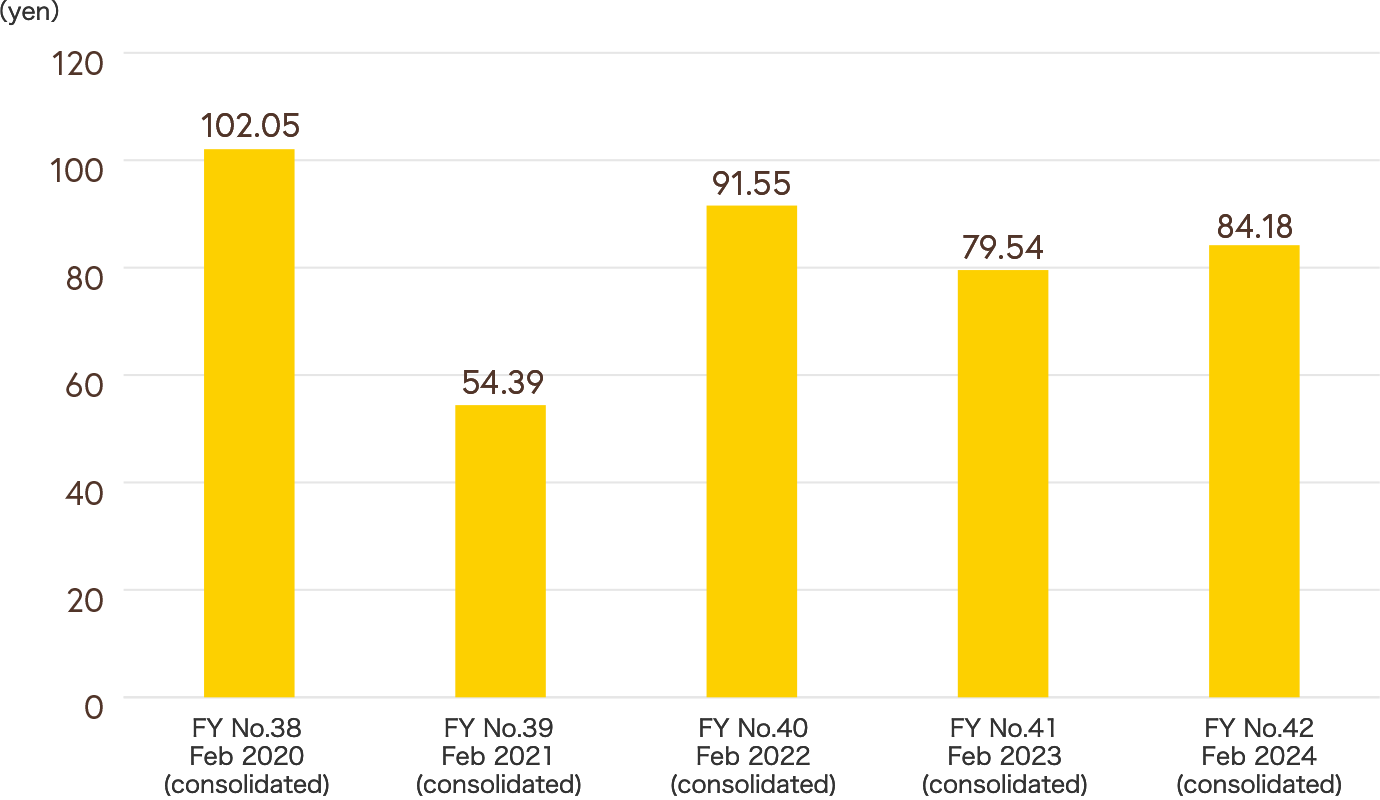
Current net profit per share *
Net assets per share *
Dividend per share *
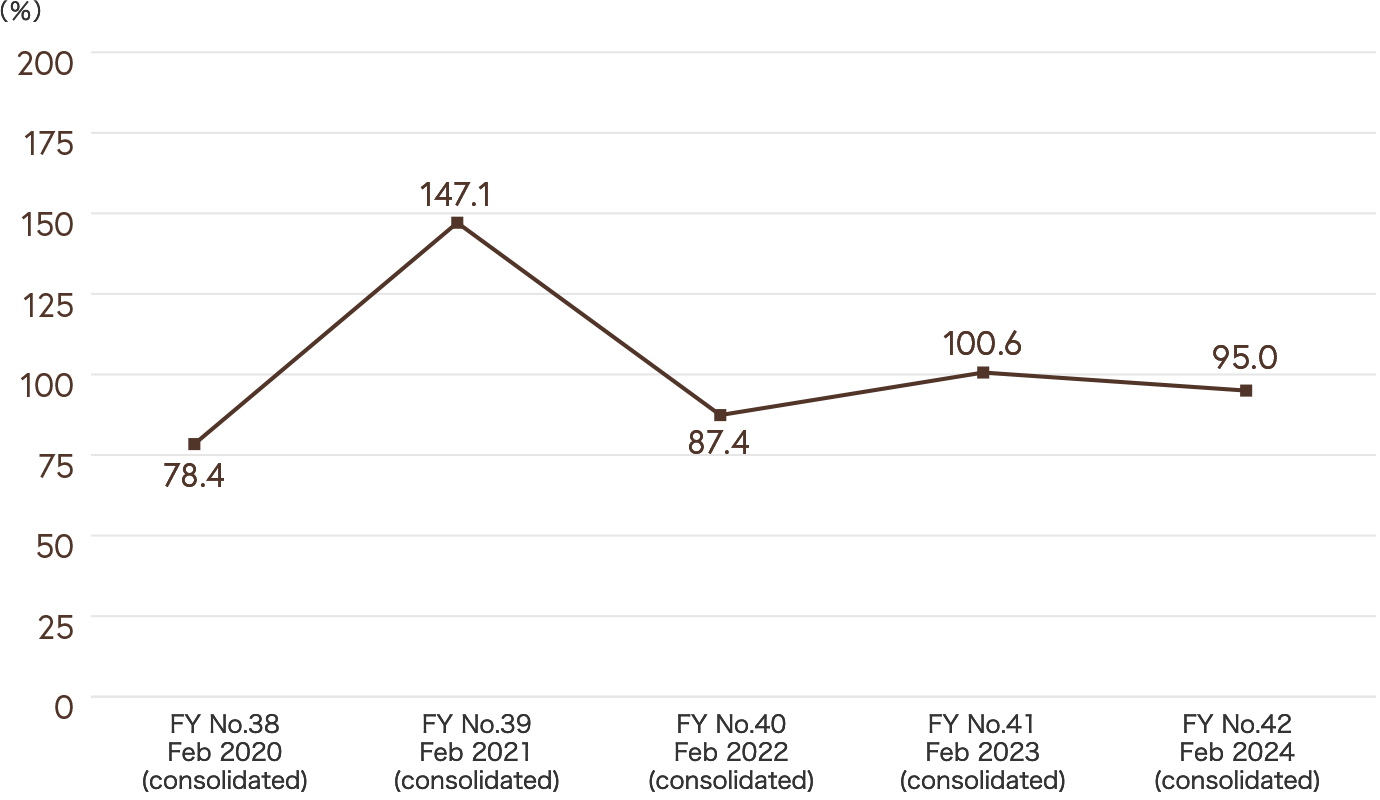
Dividend payout ratio
DOE (dividend on equity)

Note; The Company conducted a 5-for-1 stock split of its common stock on March 1, 2024, and therefore the calculation was retroactive.